


Getting to Grips with LaTeX
Tables
In academic writing, tables are a common feature, often for summarising results from research. It is therefore a skill that needs mastering in order to produce good quality papers.
However, if there is one area about Latex that I feel is the least intuitive, then I am afraid that this is it. Basic tables are not too taxing, but you will quickly notice that anything more advanced can take a fair bit of construction. So, we will start slowly and build up from there.
The Tabular environment
To begin, we shall first get familiar with some Latex terminology. An environment in Latex is a special declaration for formatting specific types of text. For example, in the bibliographies tutorial the abstract environment was introduced, so that the abstract of the paper could be formatted differently that the main body of text. All environments begin and end in the same fashion:
\begin{environment-name}
...
...
\end{environment-name}
The tabular is another such environment, designed for formatting your data into nicely arranged tables. Arguments are required after the environment declaration to describe the alignment of each column. The number of columns does not need to be specified as it is inferred by looking at the number of arguments provided. It is also possible to add vertical lines between the columns here. The following symbols are available to describe the table columns:
| l | left-justified column |
| c | centered column |
| r | right-justified column |
| | | vertical line |
| || | double vertical line |
Once in the environment,
| & | column separator |
| \\ | start new row |
| \hline | horizontal line |
Note, any white space inserted between these commands is purely down to ones' preferences. I personally add spaces between to make it easier to read.
There also exists a handy array package which extends some of the features of the tabular environment. In particular, there are three additional column formatting arguments:
| p{width} | paragraph column with text vertically aligned at the top |
| m{width} | paragraph column with text vertically aligned in the middle |
| b{width} | paragraph column with text vertically aligned at the bottom |
Obviously, you must remember to \usepackage{array} in your document preamble.
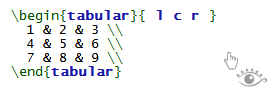
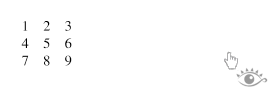
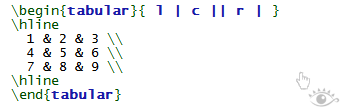
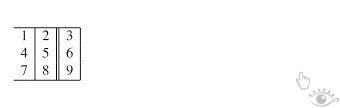
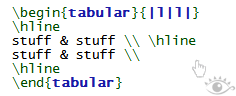
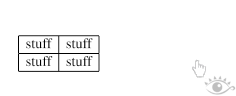
Very basic table
This example shows how to create a simple table in LaTeX. It is a three-by-three table, but without any lines.
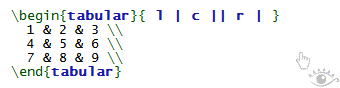
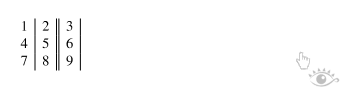
Expanding upon that by including some vertical lines:
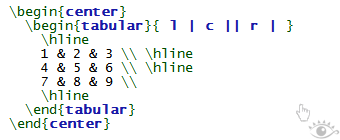
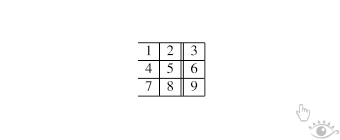
To add horizontal lines to the very top and bottom edges of the table:
And finally, to add lines between all rows, as well as centring (notice the use of the center environment - of course, the result of this is not obvious from the preview on this web page, so look at the PDF output):
Text wrapping in tables
LaTeX's algorithms for formatting tables have a few shortcomings. One is that it will not automatically wrap text in cells, even if it has overrun the width of the page. For columns that you know will contain a certain amount of text, then it is recommended that you use the p attribute and specify the desired width of the column (although it may take some trail-and-error to get the result you want).
Before we can proceed, we must introduce the Latex system of using measurements. This is quite flexible, as you can choose from a variety of length units.
- pt - a point is 1/72 inch.
- mm - millimetre.
- cm - centimetre.
- in - inch.
- ex - roughly the height of an 'x' in the current font.
- em - roughly the width of an 'M' (note the uppercase) of the current font.
There are also things known as command lengths, which are not fixed values as they depend on the configuration of the current document class and/or preamble. Useful ones include:
- \parindent - the size of the paragraph indent
- \baselineskip - vertical distance between lines.
- \parskip - the extra space between paragraphs.
- \textwidth - the width of a line of text in the local environment (e.g., the lines are commonly narrower in the abstract than in the normal text).
- \textheight - the height of the text on the page.
The examples prepared are quite long because I was illustrating what happens when there is a fair bit of text in table cells. So instead of reproducing it within the page, go directly to the example LaTeX file, wrapped.tex and then view the output.
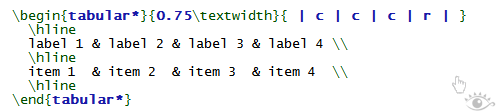
The Tabular* environment - controlling table width
This is basically a slight extension on the original tabular version, although it requires an extra argument (before the column descriptions) to specify the preferred width of the table.
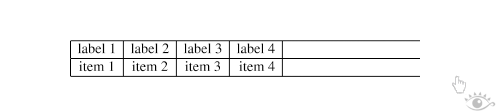
However, that doesn't look quite as intended. The columns are still at their natural width (just wide enough to fit their contents whilst the rows are as wide as the table width specified. This looks very ugly. The reason for the mess is that you must also explicitly insert extra column space. Fortunately, Latex has rubber lengths, which unlike others, are not fixed, and Latex can dynamically decide how long they should be. So, the solution the current problem is:
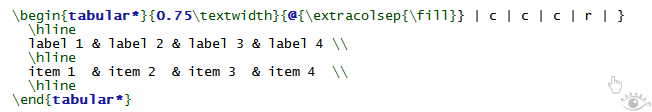

You will notice the @{...} construct added at the beginning of the column description. More details of this will be coming shortly. Within it is the \extracolsep command, which requires a width. A fixed width could have been used, however, by using a rubber length, such as \fill, the columns are automatically spaced evenly.
@-expressions
It is probably worth addressing the @ specifier now that it has been introduced, even though there aren't very many obvious applications for it.
It typically takes some text as its argument, and when appended to a column, it will automatically insert that text into each cell in that column before the actual data for that cell. It is worth noting that once used, inter-column space between the affected columns is suppressed. To add space, use @{\hspace{width}}.
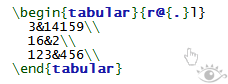
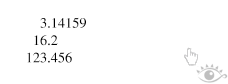
Admittedly, this is not that clear, and so will require a few examples to clarify. Sometimes, it is desirable in scientific tables to have the numbers aligned on the decimal point. This can be achieved by doing the following:
Its space suppressing qualities actually make it quite useful for manipulating the horizontal spacing between columns. Given a basic table, and varying the column descriptions:
| {|l|l|} |  |
| {|@{}l|l@{}|} |  |
| {|@{}l@{}|l@{}|} |  |
| {|@{}l@{}|@{}l@{}|} |  |
Spanning
To complete this tutorial, a quick at how to generate slightly more complex tables. Unsurprisingly, the commands necessary have to be embedded within the table data itself.Rows spanning multiple columns
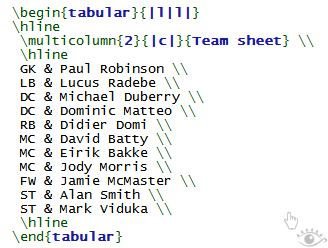
The the command for this looks like this: \multicolumn{num_cols}{alignment}{contents}. num_cols is the number of subsequent columns to merge; alignment is pretty obvious, either l, c, or r. And contents is simply the actual data you want to be contained within that cell. A simple example:
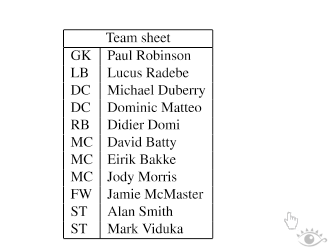
Columns spanning multiple rows
The first thing you need to do is add \usepackage{multirow} to the preamble. This then provides the command needed for spanning rows: \multirow{num_rows}{width}{contents}. The arguments are pretty simple to deduce. With the width parameter, you can specify a fixed with if you wish, or, if you want the natural width (i.e., just wide enough to fit the contents of the column) then simply input an asterisk (*). This approach was used for the following example:
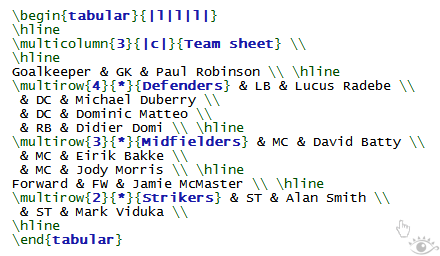
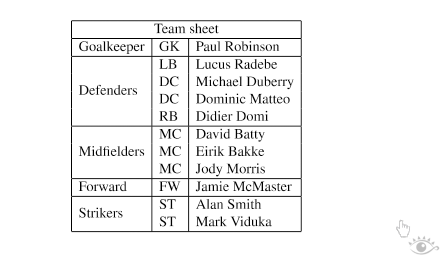
The main thing to note when using \multirow is that for the subsequent rows that are to be spanned, a blank entry for the appropriate cells have to be inserted.
Summary
That's about it for basic tables in my opinion. After you experiment, you do quickly get up to scratch. I must admit, the table syntax in Latex can look rather messy, and so seeing new examples can look confusing. But hopefully, enough has been covered here so that you can create any table you are likely to need for your papers. Unsurprisingly, Latex has plenty more up its sleeve, so expect a follow up tutorial covering more advanced features in the near future.
Last updated: November 5, 2011
Glad you liked it. Would you like to share?
Add New Comment
Showing 10 of 20 comments
- M Subscribe by email
- S RSS
Load more comments